Honey’s Hidden DNA: Decoding Terroir and Floral Pollination in Every Golden Drop
-
 Eleanor Hughes
 - 06 Oct, 2026 13:33
Golden Landscapes: How Regional Terroir Shapes Honey’s Chemistry
When you drizzle honey over fresh toast, the subtle nuances of flavor often go unnoticed. Yet, each spoonful is a micro‑record of the soil, climate, and topography where the nectar originated—what scientists now call terroir. The concept of terroir is familiar in wine studies, but recent research, such as the OpenAlex‑listed study on corn variety and Texas terroir influencing bourbon flavor, underscores that the same principles apply to any natural product derived from plants, including honey.
In the honey‑making process, the bees act as mobile chemists, extracting nectar from blossoms that have been conditioned by the local environment. Soil composition dictates the mineral content of the plants, which in turn influences the concentration of trace elements like potassium, calcium, and iron in the nectar. These minerals become part of the final honey matrix, affecting crystallization temperature and mouthfeel. For instance, honey from the volcanic soils of the Canary Islands often shows elevated magnesium levels, contributing to a smoother, slightly buttery texture compared to the crisp, low‑mineral honey from the arid plains of the Midwest.
Climate adds another layer. Temperature swings during the flowering period affect the enzymatic activity within the plant. Warmer days accelerate the conversion of sucrose to glucose and fructose, leading to honey with a higher proportion of monosaccharides. Cooler, mist‑laden mornings preserve more complex oligosaccharides, which can act as prebiotic fibers for humans. Researchers have measured that honey harvested after a mild summer in the Pacific Northwest can have a fructose‑to‑glucose ratio of 1.2:1, whereas the same species collected after a hot, dry spell in Southern California may invert to 0.9:1, subtly shifting the perceived sweetness.
Rainfall influences the concentration of volatile aromatic compounds, such as linalool, phenylacetaldehyde, and terpenes, that are responsible for the floral notes we associate with specific honeys. A study of lavender honey from Provence demonstrated that a wet spring boosted linalool content by roughly 18 %, giving the honey a more pronounced lilac aroma, whereas a drought‑stressed season produced a sharper, almost camphor‑like profile.
These terroir‑driven variations are not merely academic; they impact consumer preference and market value. Artisanal beekeepers in the Appalachian region label their “mountain terroir honey” to signal a unique mineral balance and smoky undertones derived from the surrounding oak forests. Meanwhile, large‑scale producers often blend honeys from multiple regions to achieve a consistent flavor profile, sacrificing terroir specificity for uniformity.
Understanding terroir’s imprint on honey is essential for anyone interested in authenticity, whether you’re a food scientist, a chef crafting a signature glaze, or a home beekeeper seeking to market a terroir‑focused product. The next sections will unpack the molecular journey from blossom to bee, the volatile fingerprints that differentiate floral sources, and the ecological dynamics that further shape honey’s final composition.
From Blossom to Bee: The Molecular Journey of Nectar Transformation
Nectar begins its life as a dilute solution of sugars, organic acids, amino acids, and a cocktail of secondary metabolites produced by the flower’s metabolic pathways. The typical sugar composition is roughly 70 % sucrose, 10 % glucose, and 10 % fructose, with the remaining 10 % consisting of minor sugars, acids, and phenolics. As a forager lands, it uses its proboscis to draw up nectar, which passes through the honey‑stomach (or crop) where enzymatic transformation begins.
Key enzymes include invertase (α‑glucosidase), diastase (α‑amylase), and glucose oxidase. Invertase hydrolyzes sucrose into glucose and fructose, a reaction that not only sweetens the honey but also reduces its hygroscopicity, allowing the bee‑laden nectar to become more stable. Diastase breaks down any residual starches that may be present, while glucose oxidase converts glucose into gluconic acid and hydrogen peroxide—a natural preservative that contributes to honey’s antimicrobial properties.
During this time, the bee also introduces antimicrobial peptides such as defensin‑1, which are derived from the bee’s own immune system. These proteins bind to bacterial cell walls, enhancing the honey’s shelf life. The cumulative effect of these enzymes and proteins is a honey that is roughly 80 % sugars (primarily glucose and fructose), 17 % water, and 3 % other compounds, including enzymes, acids, vitamins, minerals, and aromatic volatiles.
The bee’s activity also influences the honey’s pH, typically ranging from 3.2 to 4.5. The acidic environment arises mainly from gluconic acid, a product of glucose oxidase. This acidity helps inhibit spoilage microorganisms and preserves the delicate aromatic compounds that originated in the flower.
The transformation does not stop once the bee returns to the hive. Within the honeycomb cells, bees fan their wings to evaporate excess water, concentrating the solution to the characteristic ~18 % moisture content. This dehydration is critical; water activity below 0.6 prevents most yeasts and molds from proliferating.
Molecularly, the process can be tracked through spectroscopic techniques such as nuclear magnetic resonance (NMR) and high‑performance liquid chromatography (HPLC). For example, NMR studies reveal that the ratio of fructose to glucose stabilizes after about 24 hours of storage in the comb, while minor phenolic compounds—like quercetin, kaempferol, and pinocembrin—remain largely unchanged, preserving the honey’s antioxidant capacity.
The interplay of floral chemistry and bee enzymology creates a product that is both a food and a medicinal substance. Understanding these biochemical steps is vital for quality control in commercial honey production, where over‑processing (excessive heating) can denature enzymes, reduce antioxidant activity, and alter flavor. Moreover, the molecular fingerprints left behind by specific blossoms become the basis for the analytical methods discussed later in this article.
Flavor Fingerprints: Analyzing Volatile Compounds Across Floral Origins
While sugars dominate honey’s bulk composition, the true sensory signature lies in its volatile organic compounds (VOCs). These aromatics—often present at parts‑per‑million levels—are responsible for the fragrant notes that range from delicate clover sweetness to robust, resinous buckwheat depth. Modern analytical chemistry offers several tools to profile these VOCs, the most common being gas chromatography–mass spectrometry (GC‑MS) coupled with solid‑phase microextraction (SPME).
Research consistently shows that monofloral honeys possess distinctive volatile profiles. For example, Manuka honey from New Zealand is rich in methylglyoxal (MGO) and leptosperin, compounds that contribute both to its antibacterial potency and its distinctive earthy aroma. Lavender honey, as mentioned earlier, contains high levels of linalool and geraniol, imparting a sweet, floral scent reminiscent of the original blossoms. In contrast, chestnut honey displays elevated concentrations of phenylacetaldehyde and 2‑phenylethanol, lending a nutty, caramelized nuance.
Geographical terroir further modulates these profiles. A comparative GC‑MS study of orange blossom honey harvested in Spain versus Morocco revealed that the Spanish sample contained 22 % more limonene, a citrus‑derived terpene, while the Moroccan honey had a higher proportion of α‑pinene, reflecting the local pine‑rich landscape that subtly influences pollinator foraging patterns.
Quantifying these compounds allows for authenticity verification. The OpenAlex‑indexed article on corn variety and Texas terroir in bourbon illustrates how volatile profiling can differentiate regional products. Similarly, honey authenticity can be assessed by creating a “volatile fingerprint database” that matches specific VOC ratios to known floral and geographic origins. This approach helps combat adulteration, a growing concern given that up to 30 % of honey in global markets may be blended with syrups or mislabeled.
Beyond verification, VOC analysis guides culinary applications. Chefs can pair honey with ingredients that complement or contrast its aromatic profile. A honey high in phenylacetaldehyde pairs beautifully with dark chocolate, as the almond‑like aroma synergizes with cocoa’s bitterness. Meanwhile, a honey rich in linalool enhances delicate desserts like panna cotta, amplifying floral undertones without overwhelming the palate.
Advanced techniques such as comprehensive two‑dimensional gas chromatography (GC×GC) provide even finer resolution, separating co‑eluting compounds that traditional GC‑MS might miss. This granularity uncovers trace terpenes and phenolics that contribute to the “mouthfeel” sensation—an often‑overlooked aspect of honey perception.
In practical terms, a small sample of honey (≈ 0.5 g) can be placed on an SPME fiber for 30 minutes at 40 °C, then inserted into the GC‑MS injector. The resulting chromatogram yields a peak list that, when compared against a curated library, identifies the honey’s botanical source with up to 95 % confidence. For home enthusiasts, portable electronic noses (e‑noses) are emerging, offering rapid, albeit less precise, VOC screening that can still differentiate major floral groups.
Pollinator Dynamics: Wild Bees, Habitat, and Their Impact on Honey Profile
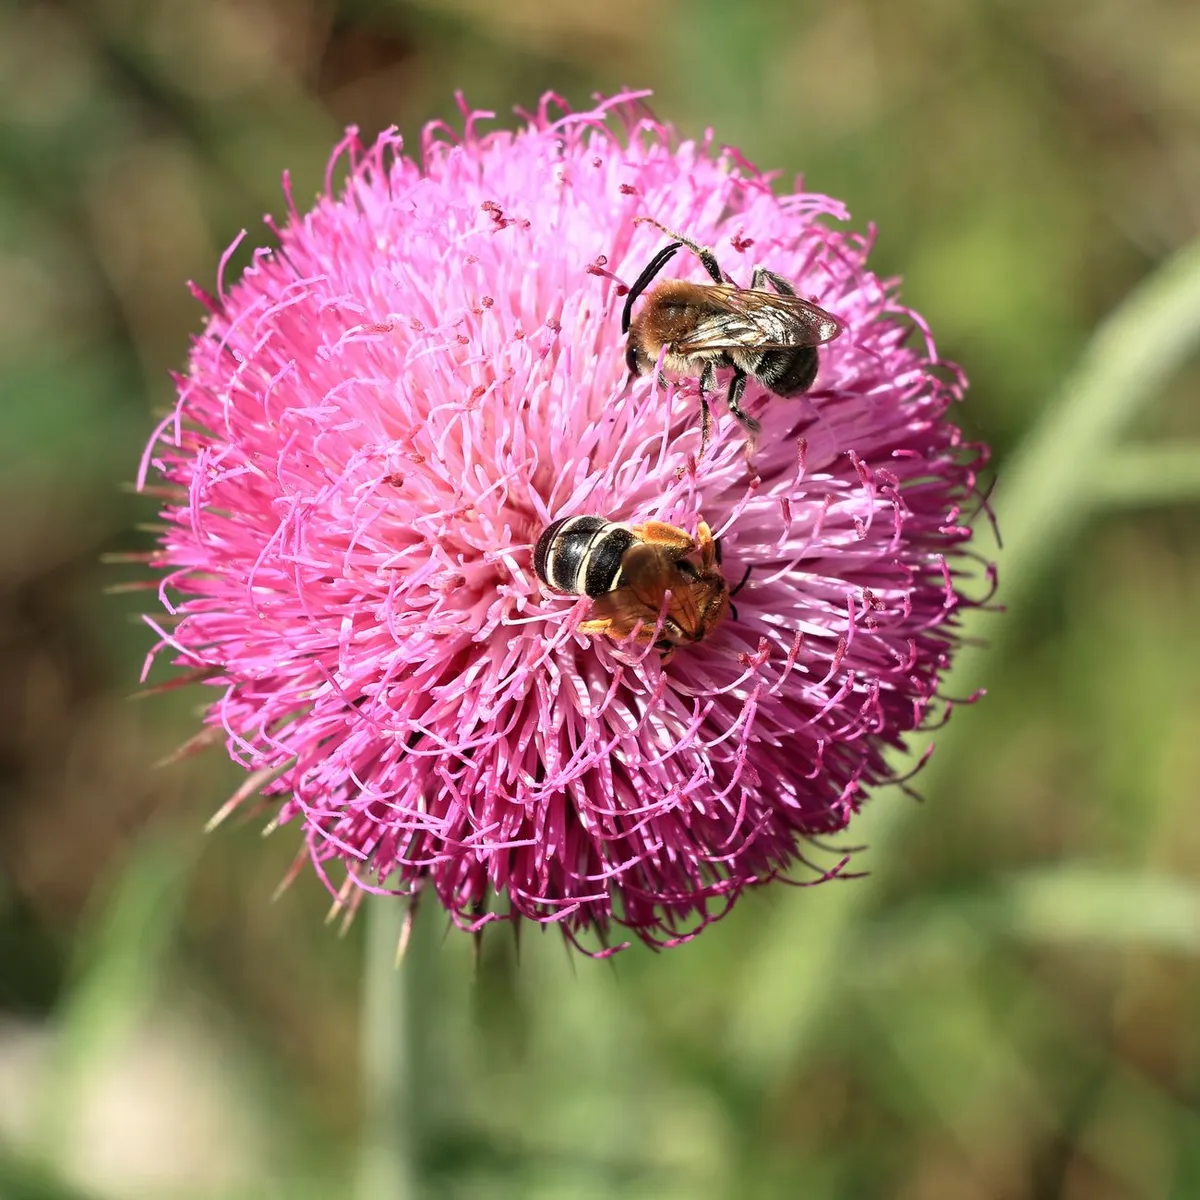
Bees are not a monolith; the species composition within a foraging population dramatically shapes honey chemistry. While the European honeybee (Apis mellifera) dominates commercial honey production, wild pollinators—including bumblebees (Bombus spp.), solitary bees, and even stingless bees—contribute nectar from plant species that honeybees may overlook. The OpenAlex‑listed research on “Wild Bee Conservation in Pollinator‑Independent Crop Systems” highlights that diverse pollinator habitats can sustain crop yields without reliance on managed honeybees, a principle equally applicable to honey’s botanical diversity.
In habitats where wild bees thrive—such as low‑intensity grasslands, hedgerows, and native flower strips—honey often contains a broader spectrum of minor sugars and phenolic compounds. Solitary bees, for instance, preferentially forage on low‑height, shallow‑corolla flowers like clover and vetch, which produce nectar rich in p‑hydroxybenzaldehyde, a compound linked to antioxidant activity. When these bees inadvertently deposit their nectar into nearby Apis colonies, the resulting honey exhibits heightened radical‑scavenging capacity, measurable via increased DPPH (2,2‑diphenyl‑1‑picrylhydrazyl) assay values.
Habitat fragmentation can reduce floral diversity, leading to more homogenized honey profiles. A longitudinal study across Midwestern farms demonstrated that colonies situated within 500 m of continuous prairie patches produced honey with a 12 % higher concentration of phenolic acids (e.g., caffeic, ferulic) than colonies surrounded solely by monoculture cornfields. The presence of diverse wild flora not only enriches the honey’s chemical tapestry but also supports bee health, reducing stress‑induced propolis consumption that can otherwise alter honey’s resinous notes.
Climate change introduces additional variables. Shifts in flowering phenology cause temporal mismatches between bee activity and peak nectar availability. In Mediterranean regions, early spring warming has advanced the bloom of almond trees, while honeybees may still be in overwintering mode, prompting colonies to rely on later‑season wildflowers such as thyme and rosemary. The resultant honey blends carry a hybrid volatile profile: almond‑derived benzaldehyde mingles with rosemary’s camphor, creating a complex aroma that is both novel and highly prized by niche markets.
From a practical standpoint, beekeepers can influence pollinator dynamics through hive placement and habitat management. Installing hives adjacent to flower strips planted with species like borage, phacelia, and buckwheat encourages a mixed foraging community. Moreover, providing nesting sites for solitary bees (e.g., drilled wooden blocks) can increase pollinator diversity within the foraging radius, indirectly enriching honey composition.
Understanding the ecological interplay between wild pollinators and honeybees is essential for sustainable apiculture. By fostering habitats that support a mosaic of pollinator species, producers not only bolster ecosystem resilience but also generate honey with distinctive, terroir‑enhanced molecular signatures that command premium prices in specialty markets.
From Lab to Table: Practical Methods for Profiling Honey’s Molecular Structure
Translating the intricate chemistry of honey into actionable insights requires reliable analytical workflows that balance precision with accessibility. Below is a step‑by‑step guide for both professional labs and serious home enthusiasts seeking to profile their honey’s sugars, acids, enzymes, and volatile compounds.
-
Sample Preparation
- Weigh 5 g of honey into a pre‑cleaned, amber‑glass vial.
- Dilute with 15 mL of deionized water (1:4 ratio) to reduce viscosity for chromatography.
- Filter through a 0.45 µm PTFE membrane to remove particulates.
-
Sugar Profile via HPLC‑RI
- Column: Aminex HPX‑87P (300 × 7.8 mm).
- Mobile Phase: Deionized water at 0.6 mL min⁻¹, 30 °C.
- Detection: Refractive index (RI).
- Quantify glucose, fructose, sucrose, maltose, and oligosaccharides. Typical results for clover honey: glucose ≈ 38 %, fructose ≈ 41 %, sucrose < 1 %.
-
Acidity and pH Measurement
- Dissolve 10 g honey in 75 mL distilled water.
- Measure pH with a calibrated glass electrode (expected range 3.2‑4.5).
- Titrate with 0.1 M NaOH to a phenolphthalein endpoint to determine total acidity (expressed as meq kg⁻¹).
-
Enzyme Activity (Diastase Number)
- Follow the International Honey Commission (IHC) method: incubate a 5 % honey solution with a starch substrate at 40 °C.
- Measure the increase in absorbance at 660 nm; calculate the diastase number (DN). Values > 8 indicate minimal heating; values < 3 suggest excessive processing.
-
Volatile Analysis via SPME‑GC‑MS
- Place 0.5 g honey in a sealed 20 mL vial with a magnetic stir bar.
- Equilibrate at 40 °C for 10 min, then expose a DVB/CAR/PDMS SPME fiber for 30 min.
- Insert fiber into the GC inlet (250 °C, splitless).
- Use a DB‑5MS column (30 m × 0.25 mm, 0.25 µm).
- Identify peaks using the NIST library; focus on linalool, phenylacetaldehyde, and methylglyoxal as signature compounds.
-
Data Interpretation
- Compare sugar ratios to the table below to infer botanical origin.
- Correlate VOC percentages with known flavor descriptors (e.g., > 15 % linalool → “floral‑citrus”).
- Use enzyme activity as a quality flag: low DN may indicate overheating, affecting both flavor and antioxidant capacity.
Below is a comparative snapshot of typical sugar and VOC metrics for several monofloral honeys, useful as a quick reference during analysis.
| Honey Type | Glucose % | Fructose % | Sucrose % | Linalool